
Businesses collect data everywhere: online stores, mobile apps, payment systems, support tools, ad platforms, CRM records, and internal spreadsheets. The problem is not usually a lack of information. The real problem is that useful information is scattered across systems that were built for daily operations, not for deep analysis. That is why teams often struggle to answer what should be simple questions, such as which products create the highest lifetime value, which marketing channels drive profitable customers, or why revenue changed between one quarter and the next.
A data warehouse solves that problem by bringing data from multiple sources into one structured place designed for reporting and analysis. Instead of forcing analysts to pull numbers from disconnected tools every week, a warehouse creates a reliable historical record that teams can query repeatedly. In plain English, it turns raw business activity into organized, searchable context for decision-making. This guide explains what a data warehouse actually does, how it differs from nearby concepts like databases and data lakes, the benefits it brings, and practical examples that show why so many modern software-driven companies depend on one.
What a Data Warehouse Actually Does
A data warehouse is a system that stores data from many sources in a way that makes analysis easier, faster, and more consistent. Its job is not to run your website, process a checkout, or update a customer profile in real time. Its job is to support questions, trends, summaries, forecasts, and business reporting.
It creates a central home for analysis
Most organizations use several operational systems at once. Sales data may live in an e-commerce platform, customer records in a CRM, ad spend in marketing tools, and billing data in finance software. A warehouse pulls the relevant pieces together so teams can work from the same foundation. That matters because business questions often cross departments. If sales, marketing, finance, and product teams all use different source systems, they can easily end up with different answers to the same question.
It keeps historical data useful
Operational tools usually focus on the present state of a process. They are excellent for handling transactions, but not always ideal for long-term analysis. A warehouse is designed to preserve and organize history. That means a business can compare this month with last year, track customer behavior over time, measure seasonality, or spot slow-moving changes that would be hard to see in day-to-day systems.
It makes complex reporting practical
Imagine asking an application database to combine website signups, subscription upgrades, refunds, support tickets, and ad spend every morning for a dashboard used by five departments. That can be slow, expensive, and risky for the production system. A warehouse separates analytical work from transactional work. Analysts can run large queries without interfering with the software people use to do their jobs.
In short, a data warehouse acts as the organized memory of a business. It collects, cleans, and structures information so teams can measure performance with confidence rather than guesswork.
How It Differs From Databases, Data Lakes, and BI Tools
Many people hear terms like database, data lake, dashboard, and warehouse used in the same conversation and assume they are interchangeable. They are related, but they are not the same thing. Understanding the difference helps explain why a warehouse exists at all.
Data warehouse vs operational database
An operational database supports live application activity. It records orders, user accounts, inventory updates, and other fast-changing transactions. It is optimized for inserting, updating, and retrieving current records efficiently.
A data warehouse is optimized for analysis. It usually contains integrated data from multiple systems, often arranged around business subjects such as customers, products, subscriptions, or revenue. Instead of asking, What is this customer doing right now? a warehouse is better at answering, How did customer retention change across the last eight quarters by acquisition source?
Data warehouse vs data lake
A data lake generally stores large amounts of raw or lightly processed data in its original format. That can include structured data, semi-structured logs, JSON events, CSV exports, images, or other files. Lakes are flexible and useful when a company wants to keep data before deciding exactly how it will be modeled.
A data warehouse is more structured. The data is usually cleaned, standardized, and organized for known analytical use cases. If a data lake is a large storage reservoir, a warehouse is the part where information is prepared so people can use it reliably for business questions.
Many organizations use both. The lake stores raw material; the warehouse stores trusted analytical tables.
Data warehouse vs BI tool
A business intelligence tool sits closer to the presentation layer. It helps users explore data, build charts, and share dashboards. The BI tool is often what managers see. The warehouse is what makes those dashboards accurate and scalable behind the scenes.
Without a stable warehouse, a dashboard can become a polished view of messy, inconsistent logic. With a warehouse, the BI tool can pull from shared definitions and curated data models.
Why this distinction matters
- Databases run applications and transactions.
- Data lakes keep large volumes of raw data.
- Data warehouses organize trusted data for analysis.
- BI tools turn analyzed data into reports and dashboards.
That division of labor is the unique angle of a warehouse. It is not just another storage product. It is the analytical foundation that sits between scattered raw systems and the reports executives depend on.
Core Benefits for Teams and Businesses
The value of a data warehouse becomes obvious when reporting starts to break down. Teams spend less time arguing over numbers and more time understanding what the numbers mean.
Faster reporting
When data is already collected, cleaned, and modeled in one place, common reports become much easier to generate. Analysts no longer need to rebuild the same spreadsheet joins every week. Leaders can review metrics sooner, and operational teams can react faster.
Cleaner and more consistent analytics
A warehouse helps standardize definitions. Revenue, active user, conversion, churn, and margin can all mean slightly different things in different systems. A good warehouse turns those into shared metrics, reducing confusion across teams.
Better cross-team visibility
Because a warehouse combines information from multiple departments, it shows relationships that isolated tools hide. Marketing can see downstream revenue quality. Finance can see operational drivers behind cost changes. Product teams can see how feature usage connects to retention.
More reliable historical analysis
Historical reporting is one of the strongest reasons to build a warehouse. It supports:
- Year-over-year comparisons
- Cohort analysis
- Seasonality tracking
- Customer lifetime value measurement
- Long-range forecasting
Stronger decision support
Decision-makers need context, not isolated numbers. A warehouse makes it possible to connect causes and outcomes. For example, a retailer can relate promotions to inventory movement and profit, while a software company can compare trial behavior with long-term subscription conversion.
The real benefit is not just technical efficiency. It is organizational clarity. A warehouse helps a business move from fragmented reporting to shared understanding.
Key Components Behind the Scenes
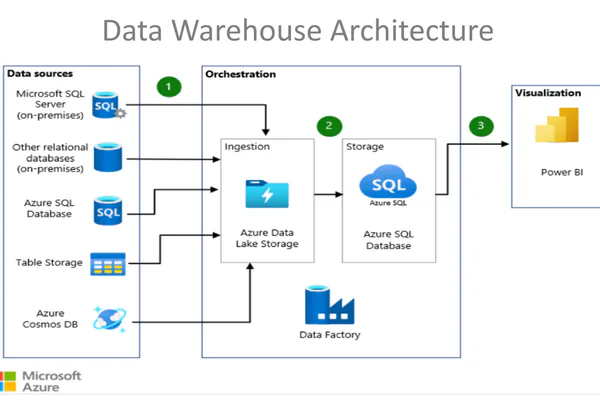
A data warehouse may sound abstract, but its building blocks are straightforward once you see how they fit together. Most implementations include data sources, pipelines, storage, models, and access tools.
Data sources
These are the original systems where information is created. Common examples include:
- Transactional databases from websites or apps
- CRM platforms
- Payment and billing systems
- Marketing and advertising platforms
- Customer support software
- CSV exports and internal spreadsheets
ETL and ELT pipelines
Data has to move into the warehouse somehow. That is where ETL and ELT come in.
- ETL means extract, transform, load. Data is cleaned and reshaped before it lands in the warehouse.
- ELT means extract, load, transform. Raw data is loaded first, then transformed inside the warehouse environment.
Both approaches aim to make source data usable. The right choice depends on tools, scale, and team workflow.
Storage and modeling
Once data is loaded, it is organized into analytical structures. Many warehouses use models that separate measurable events from descriptive context. You may hear terms like fact tables and dimension tables. In simple terms, facts capture events such as orders or page views, while dimensions describe things such as customers, products, or dates.
This structure makes it easier to aggregate metrics and answer questions consistently.
Query and access layers
A warehouse becomes useful when analysts, data teams, or reporting tools can query it. SQL is commonly used because it works well for filtering, joining, and aggregating business data. On top of that, many organizations add semantic layers, metric definitions, or dashboards so non-technical users can explore results without writing raw queries.
Behind the scenes, the warehouse is doing disciplined organizational work: collecting, standardizing, and exposing information in a form people can trust.
Practical Examples Across Real Use Cases
The easiest way to understand a data warehouse is to look at the kinds of questions it helps answer in real organizations. The pattern is usually the same: data starts in multiple systems, gets unified in the warehouse, and becomes useful in reporting, planning, or optimization.
E-commerce sales and profitability reporting
An online retailer may sell through its own website, a marketplace, and physical pickup points. Orders, returns, shipping costs, ad spend, and inventory movement all sit in different systems. A warehouse combines them to answer questions like:
- Which products create the highest profit after returns and shipping?
- Which customer acquisition channels bring repeat buyers?
- How do promotions affect margin, not just top-line sales?
Without a warehouse, those answers often require manual spreadsheet work. With one, the retailer can monitor performance daily and make faster inventory or campaign decisions.
Marketing attribution beyond simple clicks
Marketing tools are good at showing campaign activity inside their own platforms, but that is rarely enough. A warehouse can connect ad clicks, lead forms, website events, CRM stages, and closed revenue. That makes attribution more realistic.
Instead of asking only which ad generated the most traffic, a company can ask which channel brought customers with the best retention, highest average order value, or lowest refund rate. That is a far more useful business question.
Finance forecasting and executive reporting
Finance teams need stable numbers across revenue, expenses, accounts, and operating metrics. A warehouse can bring billing data together with subscription records, payroll summaries, and cost centers. That helps finance teams build recurring reports for leadership and create more defensible forecasts.
For example, a subscription business can model monthly recurring revenue trends, churn impact, expansion revenue, and customer acquisition costs in the same environment rather than combining exports by hand at the end of each month.
SaaS product analytics
A software company often tracks feature usage, trial activity, account upgrades, support interactions, and cancellations in separate systems. A warehouse lets the team see the full customer journey. Product managers can learn which behaviors predict conversion from free trial to paid plan. Customer success teams can spot patterns that predict churn. Leadership can connect product engagement with revenue growth.
This is especially valuable because application event data on its own can be noisy. The warehouse adds structure and business context.
Operations and support improvement
Warehouses are not only for revenue teams. A service-based company can combine ticket volumes, staffing data, customer satisfaction scores, and resolution times to see where service bottlenecks happen. An operations team can compare regions, shift schedules, or issue categories over time and allocate resources more intelligently.
Across these examples, the warehouse is not the final report itself. It is the system that makes richer reporting possible by joining business context that was previously trapped in separate tools.
When a Data Warehouse Is the Right Choice
Not every organization needs a full warehouse on day one. A very small team with one product and simple reporting may be fine with basic exports for a while. The need usually appears when complexity grows faster than reporting methods.
Common signs you have outgrown ad hoc reporting
- Teams pull the same data manually every week.
- Different departments report different values for the same metric.
- Dashboards depend on one analyst who knows all the spreadsheet logic.
- Historical comparisons are slow or unreliable.
- Important business data lives in several disconnected platforms.
- Production databases are being queried heavily for reporting.
Organizations that benefit most
Warehouses are especially useful for businesses that have multiple software systems, recurring reporting needs, executive dashboards, or growing analytical maturity. E-commerce brands, SaaS companies, financial teams, marketplaces, logistics operations, and multi-channel service businesses are common examples.
The threshold is less about company size and more about data fragmentation. Once strategic decisions depend on combining information across systems, a warehouse becomes much more attractive.
Common Challenges and What to Plan For
A data warehouse creates value, but it is not magic. Teams should be realistic about the work involved. Most problems come from data quality, unclear ownership, or trying to build too much too early.
Data quality issues
If source systems contain missing fields, inconsistent naming, or duplicate records, the warehouse will inherit those problems unless they are addressed. Loading bad data into a beautiful reporting layer only makes confusion faster.
Modeling complexity
Business definitions are often more complicated than they look. Revenue may need exclusions. Active users may depend on product-specific rules. Customer counts may differ between billing and CRM systems. Good modeling requires careful definitions, not just data movement.
Governance and access control
As more teams rely on shared data, governance matters. Organizations need clear ownership of core metrics, permission rules for sensitive information, and documentation that explains where important numbers come from.
Cost and maintenance
Warehouses involve storage, compute, integration tools, and team time. Costs can stay reasonable when projects are scoped carefully, but they can rise if large amounts of unnecessary data are loaded or poorly designed queries run constantly.
User adoption
A technically sound warehouse still fails if business users do not trust it or cannot interpret its outputs. Training, documentation, and clear metric naming are part of the implementation, not optional extras.
The most successful warehouse projects treat technology and process as one system. The goal is not just to centralize data, but to create dependable analytical habits across the organization.
Simple Criteria for Getting Started
If a business has decided that its reporting needs are becoming too complex for manual methods, the best next step is to start small and build deliberately.
1. Define one high-value reporting problem
Do not begin with a vague goal like improving analytics. Start with a specific business question, such as tracking customer acquisition cost against subscription revenue, creating a reliable weekly sales report, or measuring product retention by cohort.
2. Identify the minimum useful data sources
Pull in only the systems required to answer the first question well. That keeps scope under control and helps the team prove value quickly.
3. Standardize key business definitions early
Agree on what core metrics mean before dashboards spread across the company. This avoids confusion later and turns the warehouse into a source of consistency rather than another source of debate.
4. Choose tools that match team skill
Some teams need managed, cloud-friendly platforms that reduce operational work. Others may want deeper control. The right choice depends on data volume, budget, internal expertise, and expected growth. Simplicity usually wins at the start.
5. Build for trust before scale
A small warehouse with accurate data is more valuable than a huge one with unclear logic. Focus first on data quality checks, understandable models, and reports people can verify.
6. Expand in layers
Once the first use case works, add related sources and broader subject areas. This gradual approach keeps the warehouse aligned with real business needs instead of turning it into a costly side project with weak adoption.
- Start with a clear question.
- Load the smallest useful set of data.
- Define shared metrics.
- Validate outputs with stakeholders.
- Expand only after trust is established.
Conclusion
A data warehouse is best understood as an analytical foundation, not just a place to store more data. It centralizes information from multiple systems, preserves history, supports consistent metrics, and makes reporting far more practical at scale. That is why it matters to modern businesses that rely on software across sales, finance, marketing, product, and operations.
The biggest benefit is clarity. When teams stop rebuilding reports from scattered tools and start working from a shared historical record, decisions improve. Whether the use case is e-commerce profitability, SaaS retention, marketing attribution, or finance forecasting, a well-designed warehouse helps turn raw activity into useful business understanding. For organizations dealing with fragmented data and growing reporting demands, that makes a data warehouse less of a luxury and more of a practical next step.