
Every organization collects data — but collecting it and actually understanding it are two very different things. Data analytics software bridges that gap by turning raw numbers, transaction logs, and user behavior into insights that teams can act on quickly and confidently. Whether you manage a small retail operation or a large healthcare network, the right analytics tool transforms how you spot problems, detect trends, and make evidence-backed decisions.
This article explains what data analytics software is, what it typically includes, how real businesses use it across different industries, and what to look for when evaluating platforms. We will also clarify how analytics tools differ from business intelligence software, since the two terms are frequently confused.
What Data Analytics Software Actually Does
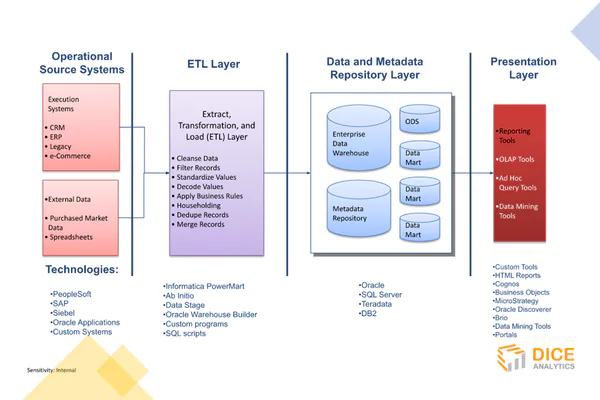
At its core, data analytics software collects data from one or more sources, processes it into a structured format, applies statistical or logical analysis, and presents results in a way that is easy to read and act on. The platform handles steps that once required a team of specialists and hours of manual effort.
The typical workflow follows four stages:
- Data collection: The platform pulls data from connected sources — databases, spreadsheets, APIs, cloud applications, or live IoT sensors — automatically and on a schedule.
- Data cleaning: Duplicate records, formatting errors, and missing values are flagged or corrected before analysis begins.
- Analysis: The software applies calculations, filters, aggregations, or machine learning models to find patterns, correlations, and outliers.
- Visualization: Results appear as charts, graphs, tables, or real-time alerts that non-technical users can interpret at a glance.
What separates analytics software from a plain spreadsheet is automation and scale. A spreadsheet requires a person to write formulas and update data manually. Analytics software can process millions of rows, refresh data automatically, and run the same analysis every hour without human intervention.
Core Features Found in Modern Analytics Tools
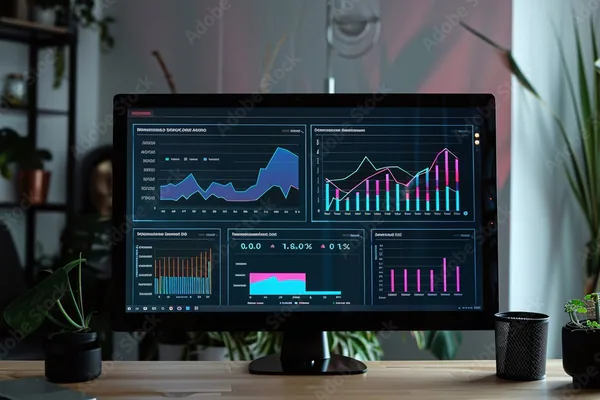
Interactive Dashboards and Scheduled Reporting
Dashboards give users a live view of key metrics in one place. Good dashboards are interactive — users can filter by date, region, product line, or team without rebuilding a report from scratch. Scheduled reports can be automatically emailed to stakeholders on a daily or weekly cadence.
Data Integration and Source Connectors
Most analytics platforms offer built-in connectors for popular tools such as Google Analytics, Salesforce, PostgreSQL, Shopify, and cloud storage services. This lets teams combine data from multiple systems into a single view rather than switching between tabs or downloading CSV exports manually.
Automated Alerts and Anomaly Detection
Instead of manually checking a dashboard, teams set threshold-based alerts. A notification fires when a website conversion rate drops below a set value or when inventory reaches a critical level. Some platforms use machine learning to detect unusual patterns without any manual threshold configuration.
Forecasting and Predictive Analytics
Advanced platforms include built-in forecasting models that project future values based on historical trends. These features support sales planning, demand forecasting, and budgeting cycles with data-driven projections rather than manual estimates.
Key Benefits for Businesses and Teams
Data analytics software delivers measurable value in areas that matter to both operational teams and senior leadership.
- Faster decision-making: When data is updated automatically and presented visually, managers spend less time gathering information and more time acting on it.
- Single source of truth: A unified analytics platform eliminates conflicting spreadsheet versions and the disagreements that follow.
- Trend detection: Analytics tools surface patterns that are impossible to spot manually — such as a gradual decline in repeat purchase rates before it becomes a revenue problem.
- Cost reduction: Identifying inefficiencies in supply chains, staffing schedules, or advertising spend can directly reduce operating costs.
- Reduced guesswork: Teams stop making decisions based on intuition alone and start using evidence-backed insights instead.
Real Examples Across Different Industries
Retail and E-Commerce
A retail chain uses analytics software to track which products are underperforming by region, then automatically flags slow-moving inventory for promotional discounts. Online stores apply funnel analysis to pinpoint exactly where customers abandon their shopping carts, allowing targeted improvements to the checkout experience.
Healthcare
Hospitals analyze patient flow data to reduce emergency department wait times. Analytics platforms help administrators identify patterns in readmission rates and flag high-risk patients for follow-up care before complications escalate into costly interventions.
Finance and Banking
Finance teams monitor transaction patterns in real time to detect potential fraud and build risk models for lending decisions. Monthly financial reports that once took days to compile can be automated into a live, self-refreshing dashboard accessible to authorized stakeholders at any time.
Marketing
Marketing teams track campaign performance across email, paid search, social media, and organic channels from a single analytics platform. They compare cost per acquisition across channels and reallocate budget toward the highest-performing ones based on real data, not assumptions.
Operations and Logistics
Logistics companies analyze route and fuel data to cut delivery costs and improve on-time rates. Manufacturing teams monitor equipment performance metrics and set predictive maintenance alerts to reduce unplanned downtime before it disrupts production schedules.
Data Analytics Software vs Business Intelligence Tools
The terms data analytics and business intelligence are often used interchangeably, but they describe different emphases. Business intelligence software focuses primarily on historical reporting — what happened last quarter, how sales performed last month, what the customer churn rate was last year. It is retrospective and structured around fixed reports and static dashboards.
Data analytics software typically goes further. It supports descriptive analytics (what happened), diagnostic analytics (why it happened), predictive analytics (what is likely to happen), and prescriptive analytics (what action to take). Modern platforms increasingly blend both capabilities, but if a tool mainly lets you build reports from existing data, it leans toward BI. If it supports forecasting, experimentation, or real-time streaming analysis, it leans firmly into analytics territory.
How to Choose the Right Solution
Selecting analytics software is not about choosing the most feature-rich platform — it is about finding the right fit for your team’s skills, existing data sources, and decision-making workflow.
- Ease of use: Can non-technical team members build dashboards without IT support?
- Integrations: Does the platform connect directly to the data sources your team already uses?
- Scalability: Will performance hold up as data volumes grow over the next few years?
- Security and compliance: Does the vendor offer role-based access, encryption, and relevant compliance certifications for your industry?
- Pricing model: Is pricing based on users, data volume, or features — and does it scale fairly with your team size?
- Support and onboarding: Are structured training resources and live support included in the plan?
Common Challenges and Mistakes to Avoid
Even with excellent software, teams run into predictable problems that undermine their analytics programs.
- Poor data quality: Analytics is only as reliable as the underlying data. Inconsistent formatting, duplicates, or missing fields in source systems produce misleading insights.
- No defined KPIs: Buying analytics software without agreeing on which metrics matter most leads to cluttered dashboards that nobody uses regularly.
- Overcomplicated dashboards: Too many charts on one screen cause cognitive overload. Effective dashboards focus on three to five key numbers per view.
- Skipping user training: Powerful tools deliver no value if staff do not know how to use them confidently. Budget for structured onboarding, not just a link to documentation.
- Buying before defining the use case: Start with a specific business question — such as why customer retention dropped last quarter — before evaluating platforms.
When Data Analytics Software Is Worth the Investment
For very small teams with low data volumes, a well-structured spreadsheet and manual reporting can still be adequate. Analytics software becomes a clear investment when any of the following applies:
- Manual reporting takes more than a few hours per week to produce.
- Decisions are regularly made without reliable data to support them.
- Data lives in three or more separate systems that do not connect to each other.
- Stakeholders need real-time performance updates but cannot access raw data directly.
- Trends and anomalies are being missed because no one has time to review everything manually.
For larger organizations, the case is almost always straightforward. The cost of delayed or wrong decisions consistently outweighs the subscription cost of solid analytics software. The question is not whether to invest, but which platform best fits the team’s workflow and existing data infrastructure.
Data analytics software has moved from a specialist tool reserved for data scientists into an everyday resource for operations, marketing, finance, and leadership teams. Understanding what it does and where it fits in your workflow is the first step toward using data as a genuine advantage rather than a growing archive of untouched reports.